
Labor Insights & ReportingLabor Insights & Reporting

Payroll tells you what you paid.
SIMPOL helps you understand why.

Payroll te dice cuánto pagaste.
SIMPOL te ayuda a entender por qué.

We turn payroll and labor data into practical reports, visuals and business conversations so you can see labor cost, location performance, overtime and hours worked with more clarity.

Convertimos payroll y labor data en reportes prácticos, visuales y conversaciones útiles para que tengas más claridad sobre labor cost, locations, overtime y horas trabajadas.

Example: decision-ready labor snapshot Ejemplo: snapshot de labor para decidir mejor Clean, visual and useful — not dashboard theater. Limpio, visual y útil — no dashboard por moda.
Live viewVista activa
Labor Cost$148.2KThis pay period · +4.8%Este período · +4.8%
Locations4 ActiveMiami · Orlando · Tampa · JacksonvilleMiami · Orlando · Tampa · Jacksonville
OT Hours138.5Most OT in OrlandoMás OT en Orlando
Hours Worked5,426Within expected rangeDentro del rango esperado

Labor cost by location

Labor cost por location

See where spend is concentrated and where cost is shifting.

Mira dónde se concentra el gasto y dónde se está moviendo el costo.

020k40k60k MiamiOrlandoTampaJacksonville $34k$49k$39k$26k

OT + hours trend

Tendencia de OT + horas

Useful to spot if more hours are turning into more overtime.

Útil para detectar si más horas se están convirtiendo en más overtime.

JanFebMarAprMayJun
Hours workedHoras trabajadasOT hoursHoras OT
The goal is simple: help the client make better labor decisions. La meta es simple: ayudar al cliente a tomar mejores decisiones de labor. Clearer visibility can save time, control overtime and support better staffing decisions. Más visibilidad puede ahorrar tiempo, controlar el overtime y apoyar mejores decisiones de staffing.
Time + resources optimizedTiempo + recursos optimizados
How the reporting layer comes togetherCómo armamos la capa de reporting

We follow the same SIMPOL logic: understand the operation, organize the data and turn it into something useful for the business.

Seguimos la misma lógica SIMPOL: entendemos la operación, organizamos la data y la convertimos en algo útil para el negocio.

01CollectRecolectarHours · payroll · location dataHoras · payroll · data por location
02CleanLimpiarStandardize fields and exceptionsEstandarizar campos y excepciones
03CompareCompararLocations · periods · teamsLocations · períodos · equipos
04VisualizeVisualizarDashboards, trends and KPIsDashboards, tendencias y KPIs
05ExplainExplicarWhat changed and why it mattersQué cambió y por qué importa
06DecideDecidirBetter labor actionsMejores decisiones de labor
Questions this service should help answerPreguntas que este servicio debe ayudar a responder

Good reporting does more than show data.
It helps you make better decisions.

Un buen reporting no solo muestra datos.
Ayuda a tomar mejores decisiones.

$

Why did labor cost move?

¿Por qué se movió el labor cost?

Spot increases by location, period, department or staffing pattern.

Identifica aumentos por location, período, departamento o patrón operativo.

OT

Where is overtime coming from?

¿De dónde viene el overtime?

See which teams or locations are driving OT and whether it looks structural or temporary.

Mira qué equipos o locations impulsan el OT y si parece estructural o temporal.

HRS

Are hours worked aligned with reality?

¿Las horas trabajadas están alineadas con la realidad?

Compare hours worked across periods, locations or against operational expectations.

Compara horas trabajadas entre períodos, locations o contra expectativas operativas.

LOC

Which location needs attention?

¿Qué location necesita atención?

Visualize which site is drifting in cost, hours or labor mix.

Visualiza qué sede se está desviando en costo, horas o mezcla de labor.

What trends keep repeating?

¿Qué tendencias se repiten?

Recurring reports make it easier to separate one-time noise from patterns worth acting on.

Los reportes recurrentes ayudan a separar ruido puntual de patrones que sí valen la pena atender.

Where can we optimize time and resources?

¿Dónde podemos optimizar tiempo y recursos?

Better visibility supports smarter staffing, fewer surprises and more focused follow-up.

Más visibilidad apoya mejor staffing, menos sorpresas y un seguimiento más enfocado.

Example of a decision-support viewEjemplo de una vista para apoyar decisiones

A report should show what matters most.

Un reporte debe mostrar lo que realmente importa.

Not just the totals — but also where to look next.

No solo los totales — también dónde mirar después.

Sample reportingReporte ejemplo

Weekly labor snapshot

Snapshot semanal de labor

A quick view of labor cost, hours and overtime across key locations.

Vista rápida de labor cost, horas y overtime en las locations principales.

Location
Labor Cost
OT Hours
Miami
$34,180
21.5
Orlando
$49,620
46.0
Tampa
$38,940
31.0
Jacksonville
$25,460
12.4
Cost concentrationConcentración de costoOT pressurePresión de OT
01
Orlando is driving both labor cost and OT.Orlando está impulsando tanto el labor cost como el OT.That combination tells management where to start the conversation first.Esa combinación le dice a management por dónde empezar la conversación.
02
Miami cost is stable with low OT.Miami muestra costo estable y bajo OT.Not every location needs the same level of follow-up.No todas las locations necesitan el mismo nivel de seguimiento.
03
Jacksonville is lower-cost, but it still deserves visibility.Jacksonville tiene menor costo, pero igual merece visibilidad.A smaller location can still matter if its trend changes over time.Una location más pequeña también importa si su tendencia cambia con el tiempo.
Our reporting philosophyNuestra filosofía de reporting

Useful first. Polished second.
Clear before complicated.

Primero útil. Después bonito.
Claro antes que complicado.

SIMPOL is not trying to impress you with a giant dashboard nobody uses. We want the business owner or manager to understand the labor story fast, ask better questions and make better decisions.

SIMPOL no busca impresionarte con un dashboard gigante que nadie usa. Queremos que el dueño o manager entienda rápido la historia de labor, haga mejores preguntas y tome mejores decisiones.
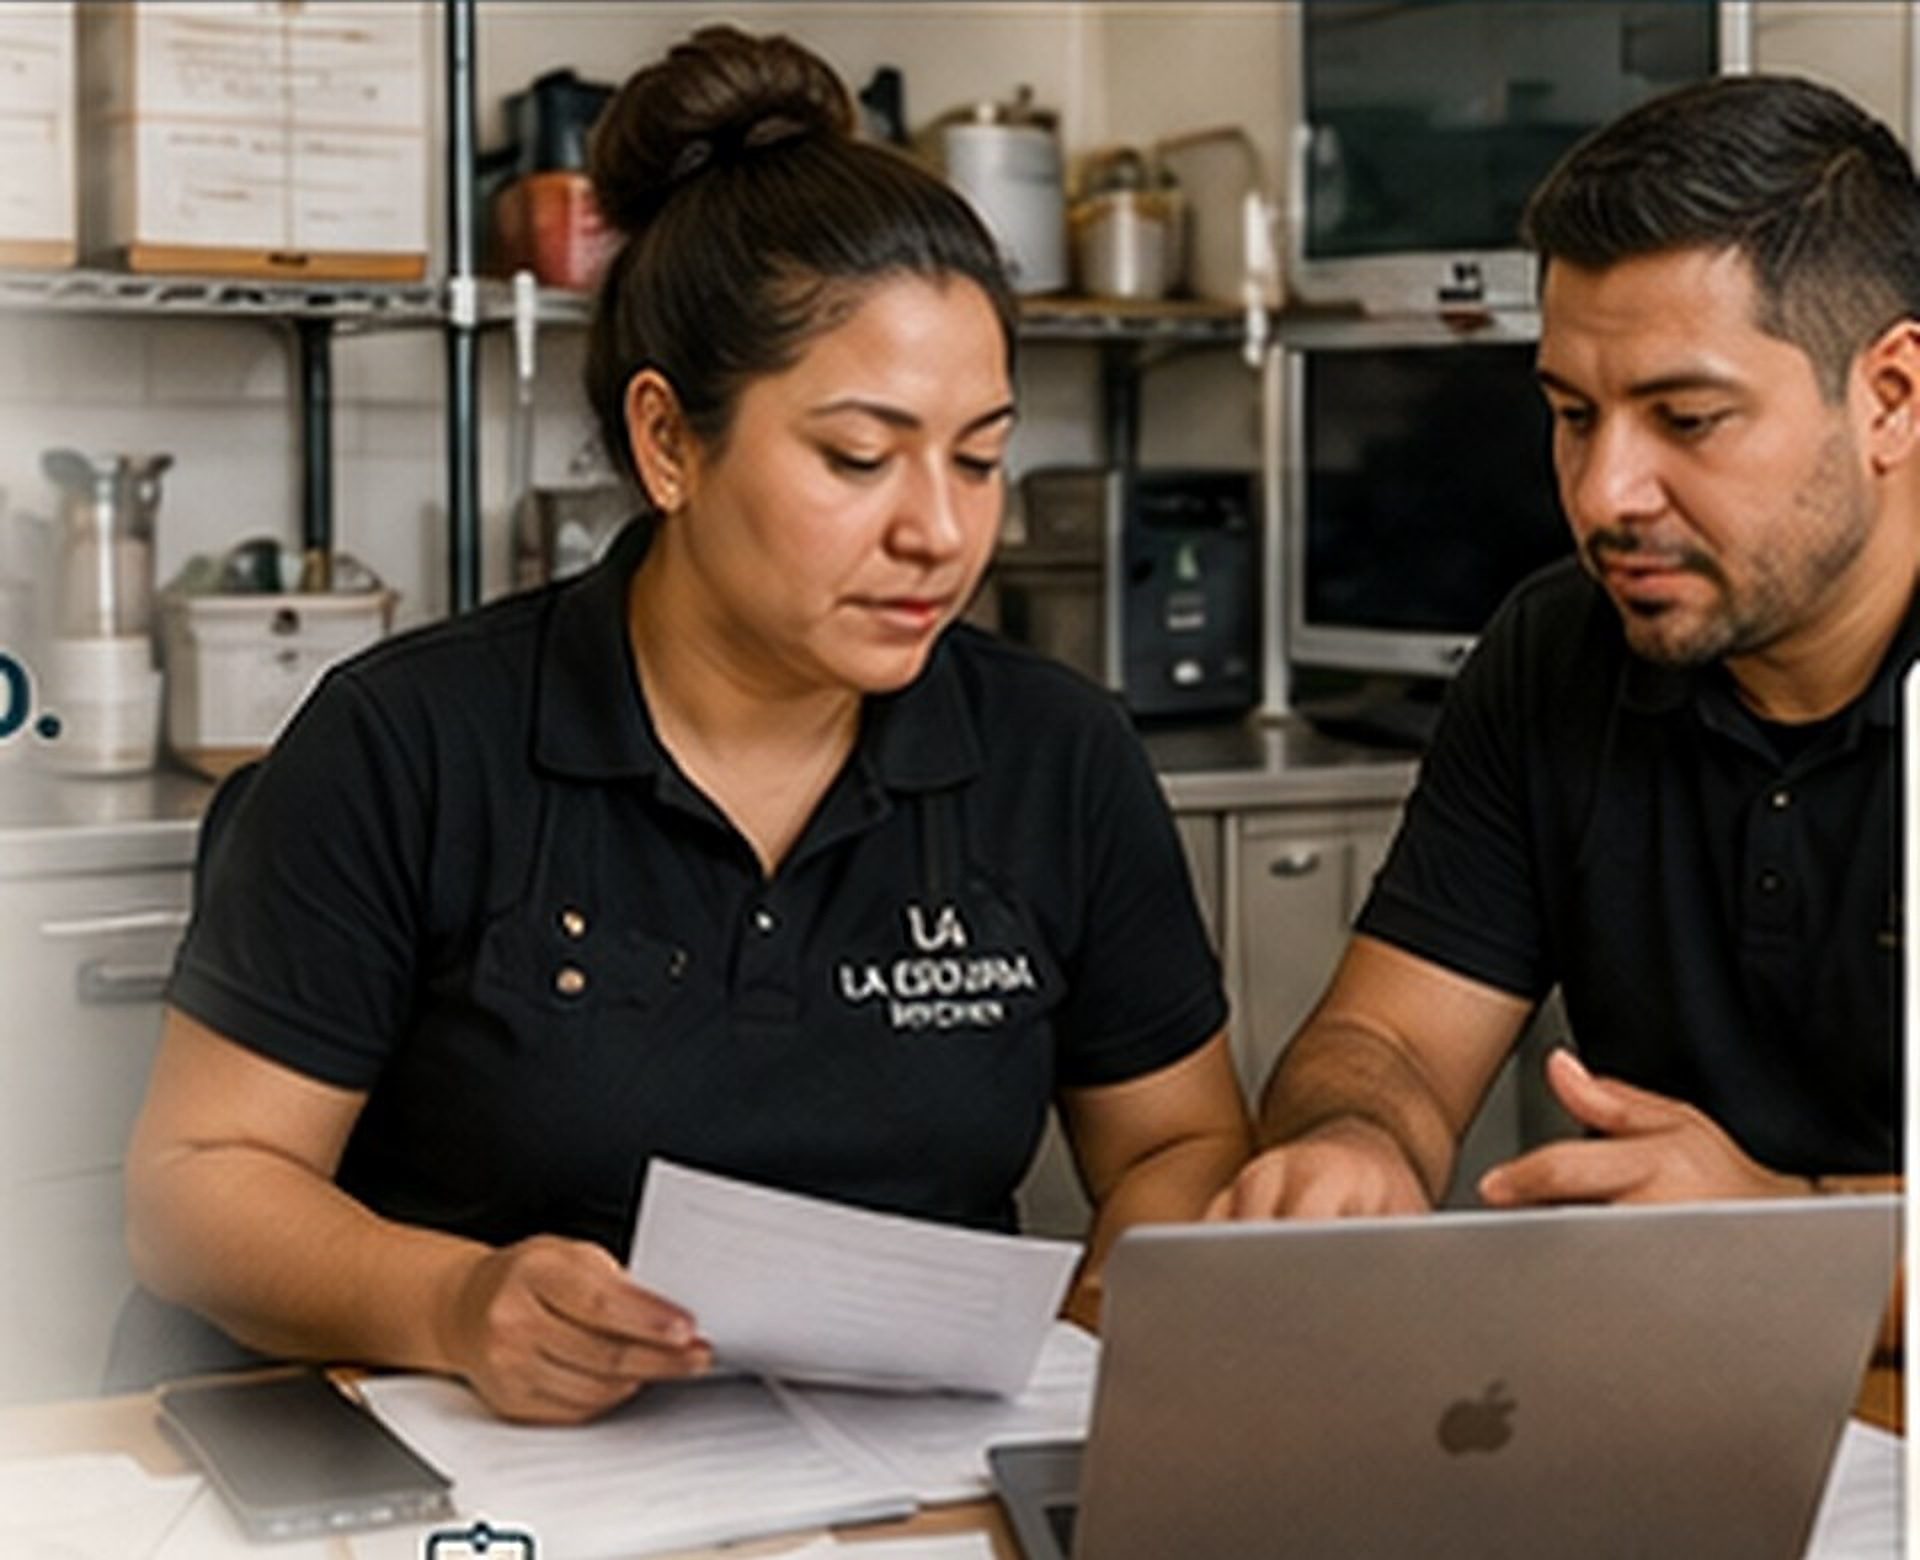
01Start with the questions that matterEmpezar por las preguntas que importan
02Use data the business can actually maintainUsar data que el negocio sí puede mantener
03Keep the visuals simple and decision-focusedMantener los visuales simples y enfocados en decisiones
04Turn reporting into follow-up actionConvertir el reporting en acciones de seguimiento
What changes with more visibilityQué cambia cuando hay más visibilidad

Less guessing.
More confident labor decisions.

Menos adivinanzas.
Decisiones de labor con más confianza.

Operations manager checking multiple spreadsheets
BeforeAntesPayroll gets processed, but labor questions keep piling up and answers take too long.El payroll se procesa, pero las preguntas de labor se siguen acumulando y responder tarda demasiado.
+

A clearer reporting rhythm

Un ritmo de reporting más claro

SIMPOL helps structure the view so leadership can spot what changed, where it happened and what deserves attention first.

SIMPOL ayuda a estructurar la vista para que liderazgo detecte qué cambió, dónde pasó y qué merece atención primero.

Business owner reviewing payroll charts and labor results
AfterDespuésRecurring reporting becomes part of the operating rhythm and supports better use of time and resources.El reporting recurrente se vuelve parte del ritmo operativo y apoya un mejor uso del tiempo y los recursos.
A practical reporting engagementUn acompañamiento práctico de reporting

You know the business.
We help make the labor data more usable.

Tú conoces el negocio.
Nosotros ayudamos a volver más usable la labor data.

CLIENT

Your side

Tu lado

  • Share your current payroll, hours or labor data
  • Compartir payroll, horas o labor data actual
  • Tell us what questions matter most to the business
  • Decirnos qué preguntas le importan más al negocio
  • Use the reporting to guide follow-up and decisions
  • Usar el reporting para guiar seguimiento y decisiones
SIMPOL

Our side

Nuestro lado

  • Structure data into clearer KPIs and comparisons
  • Estructurar la data en KPIs y comparaciones más claras
  • Build visuals and recurring report formats
  • Construir visuales y formatos recurrentes de reporte
  • Highlight what changed and what may need attention
  • Resaltar qué cambió y qué puede necesitar atención
Labor Insights & Reporting

Want clearer visibility into labor cost, OT and hours worked?

¿Quieres más claridad sobre labor cost, OT y horas trabajadas?

If you already have payroll data but need better visibility, SIMPOL can help build a reporting layer that supports real decisions.

Si ya tienes payroll data pero necesitas más visibilidad, SIMPOL puede ayudarte a construir una capa de reporting que apoye decisiones reales.

Let's Talk About ReportingHablemos de reportingPractical dashboards, recurring reports and useful labor visibility.Dashboards prácticos, reportes recurrentes y visibilidad útil de labor.
Let's Talk Payroll