
Why did labor cost move?
¿Por qué se movió el labor cost?
Spot increases by location, period, department or staffing pattern.
Identifica aumentos por location, período, departamento o patrón operativo.
We turn payroll and labor data into practical reports, visuals and business conversations so you can see labor cost, location performance, overtime and hours worked with more clarity.
Convertimos payroll y labor data en reportes prácticos, visuales y conversaciones útiles para que tengas más claridad sobre labor cost, locations, overtime y horas trabajadas.
See where spend is concentrated and where cost is shifting.
Mira dónde se concentra el gasto y dónde se está moviendo el costo.
Useful to spot if more hours are turning into more overtime.
Útil para detectar si más horas se están convirtiendo en más overtime.
We follow the same SIMPOL logic: understand the operation, organize the data and turn it into something useful for the business.
Seguimos la misma lógica SIMPOL: entendemos la operación, organizamos la data y la convertimos en algo útil para el negocio.
Spot increases by location, period, department or staffing pattern.
Identifica aumentos por location, período, departamento o patrón operativo.
See which teams or locations are driving OT and whether it looks structural or temporary.
Mira qué equipos o locations impulsan el OT y si parece estructural o temporal.
Compare hours worked across periods, locations or against operational expectations.
Compara horas trabajadas entre períodos, locations o contra expectativas operativas.
Visualize which site is drifting in cost, hours or labor mix.
Visualiza qué sede se está desviando en costo, horas o mezcla de labor.
Recurring reports make it easier to separate one-time noise from patterns worth acting on.
Los reportes recurrentes ayudan a separar ruido puntual de patrones que sí valen la pena atender.
Better visibility supports smarter staffing, fewer surprises and more focused follow-up.
Más visibilidad apoya mejor staffing, menos sorpresas y un seguimiento más enfocado.
Not just the totals — but also where to look next.
No solo los totales — también dónde mirar después.
A quick view of labor cost, hours and overtime across key locations.
Vista rápida de labor cost, horas y overtime en las locations principales.
SIMPOL is not trying to impress you with a giant dashboard nobody uses. We want the business owner or manager to understand the labor story fast, ask better questions and make better decisions.
SIMPOL no busca impresionarte con un dashboard gigante que nadie usa. Queremos que el dueño o manager entienda rápido la historia de labor, haga mejores preguntas y tome mejores decisiones.
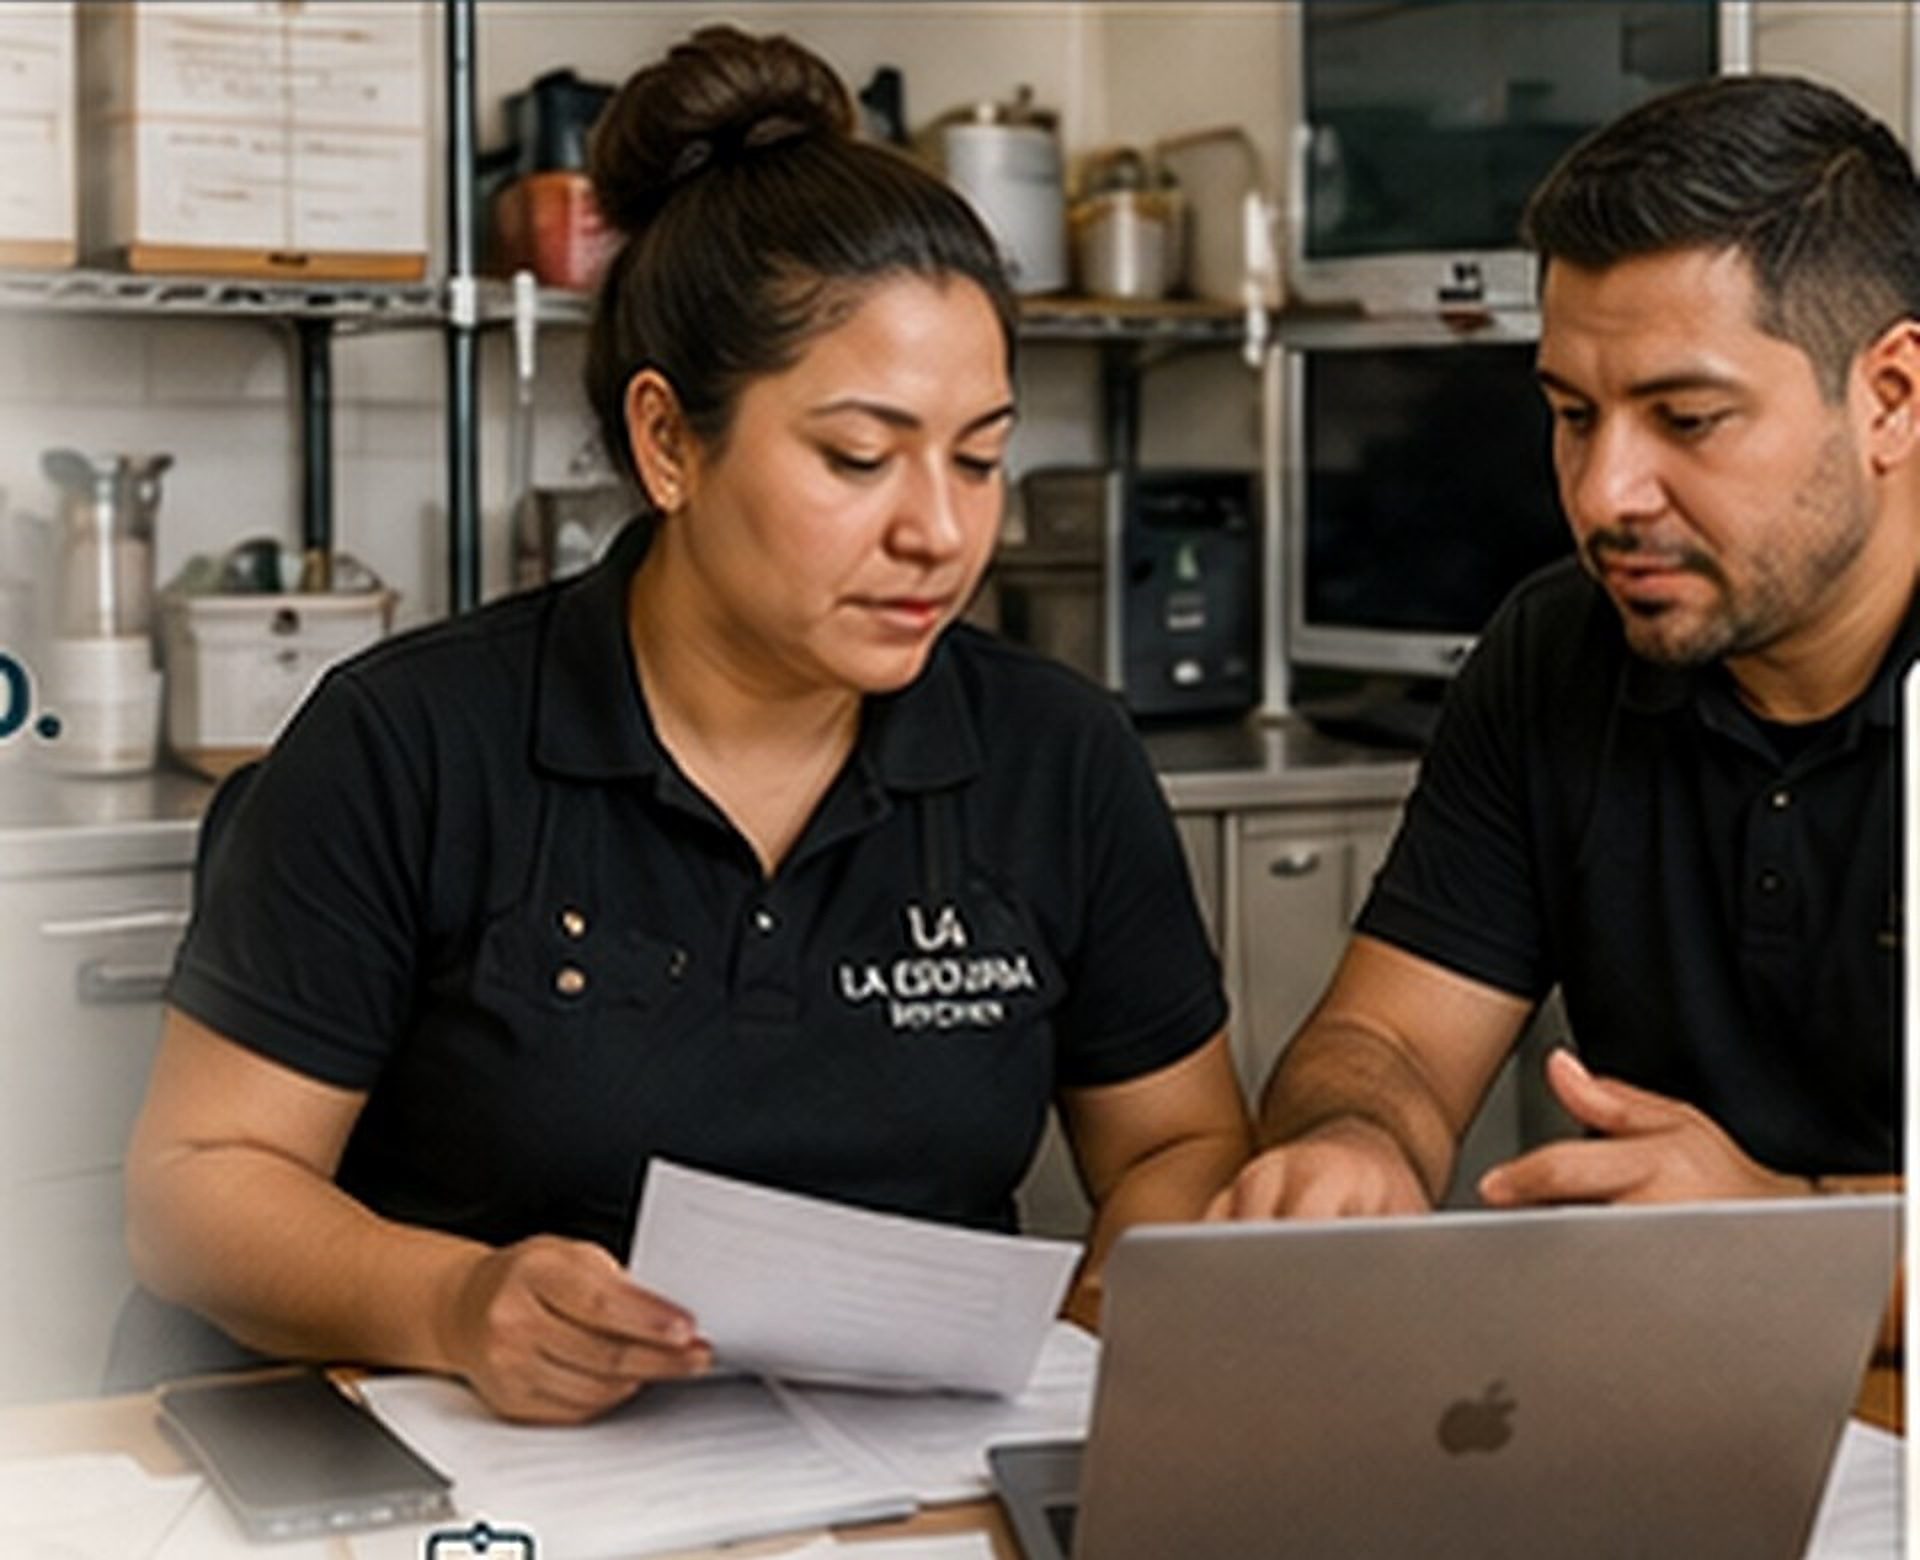
SIMPOL helps structure the view so leadership can spot what changed, where it happened and what deserves attention first.
SIMPOL ayuda a estructurar la vista para que liderazgo detecte qué cambió, dónde pasó y qué merece atención primero.

If you already have payroll data but need better visibility, SIMPOL can help build a reporting layer that supports real decisions.
Si ya tienes payroll data pero necesitas más visibilidad, SIMPOL puede ayudarte a construir una capa de reporting que apoye decisiones reales.